


See the drift before it becomes a deviation
A quality system that only reacts to failures is running a month behind its own process. We build the other kind: specifications tied to disposition, control charts with limits from your own data, and a defined response when the chart speaks.
Not ready for a call? Tell us which measure drifts the most.
A quality system that decides, not just detects
Detection is the easy half. The system we build closes the other half: who holds the product, who makes the disposition, and what changes so the same failure stops repeating.
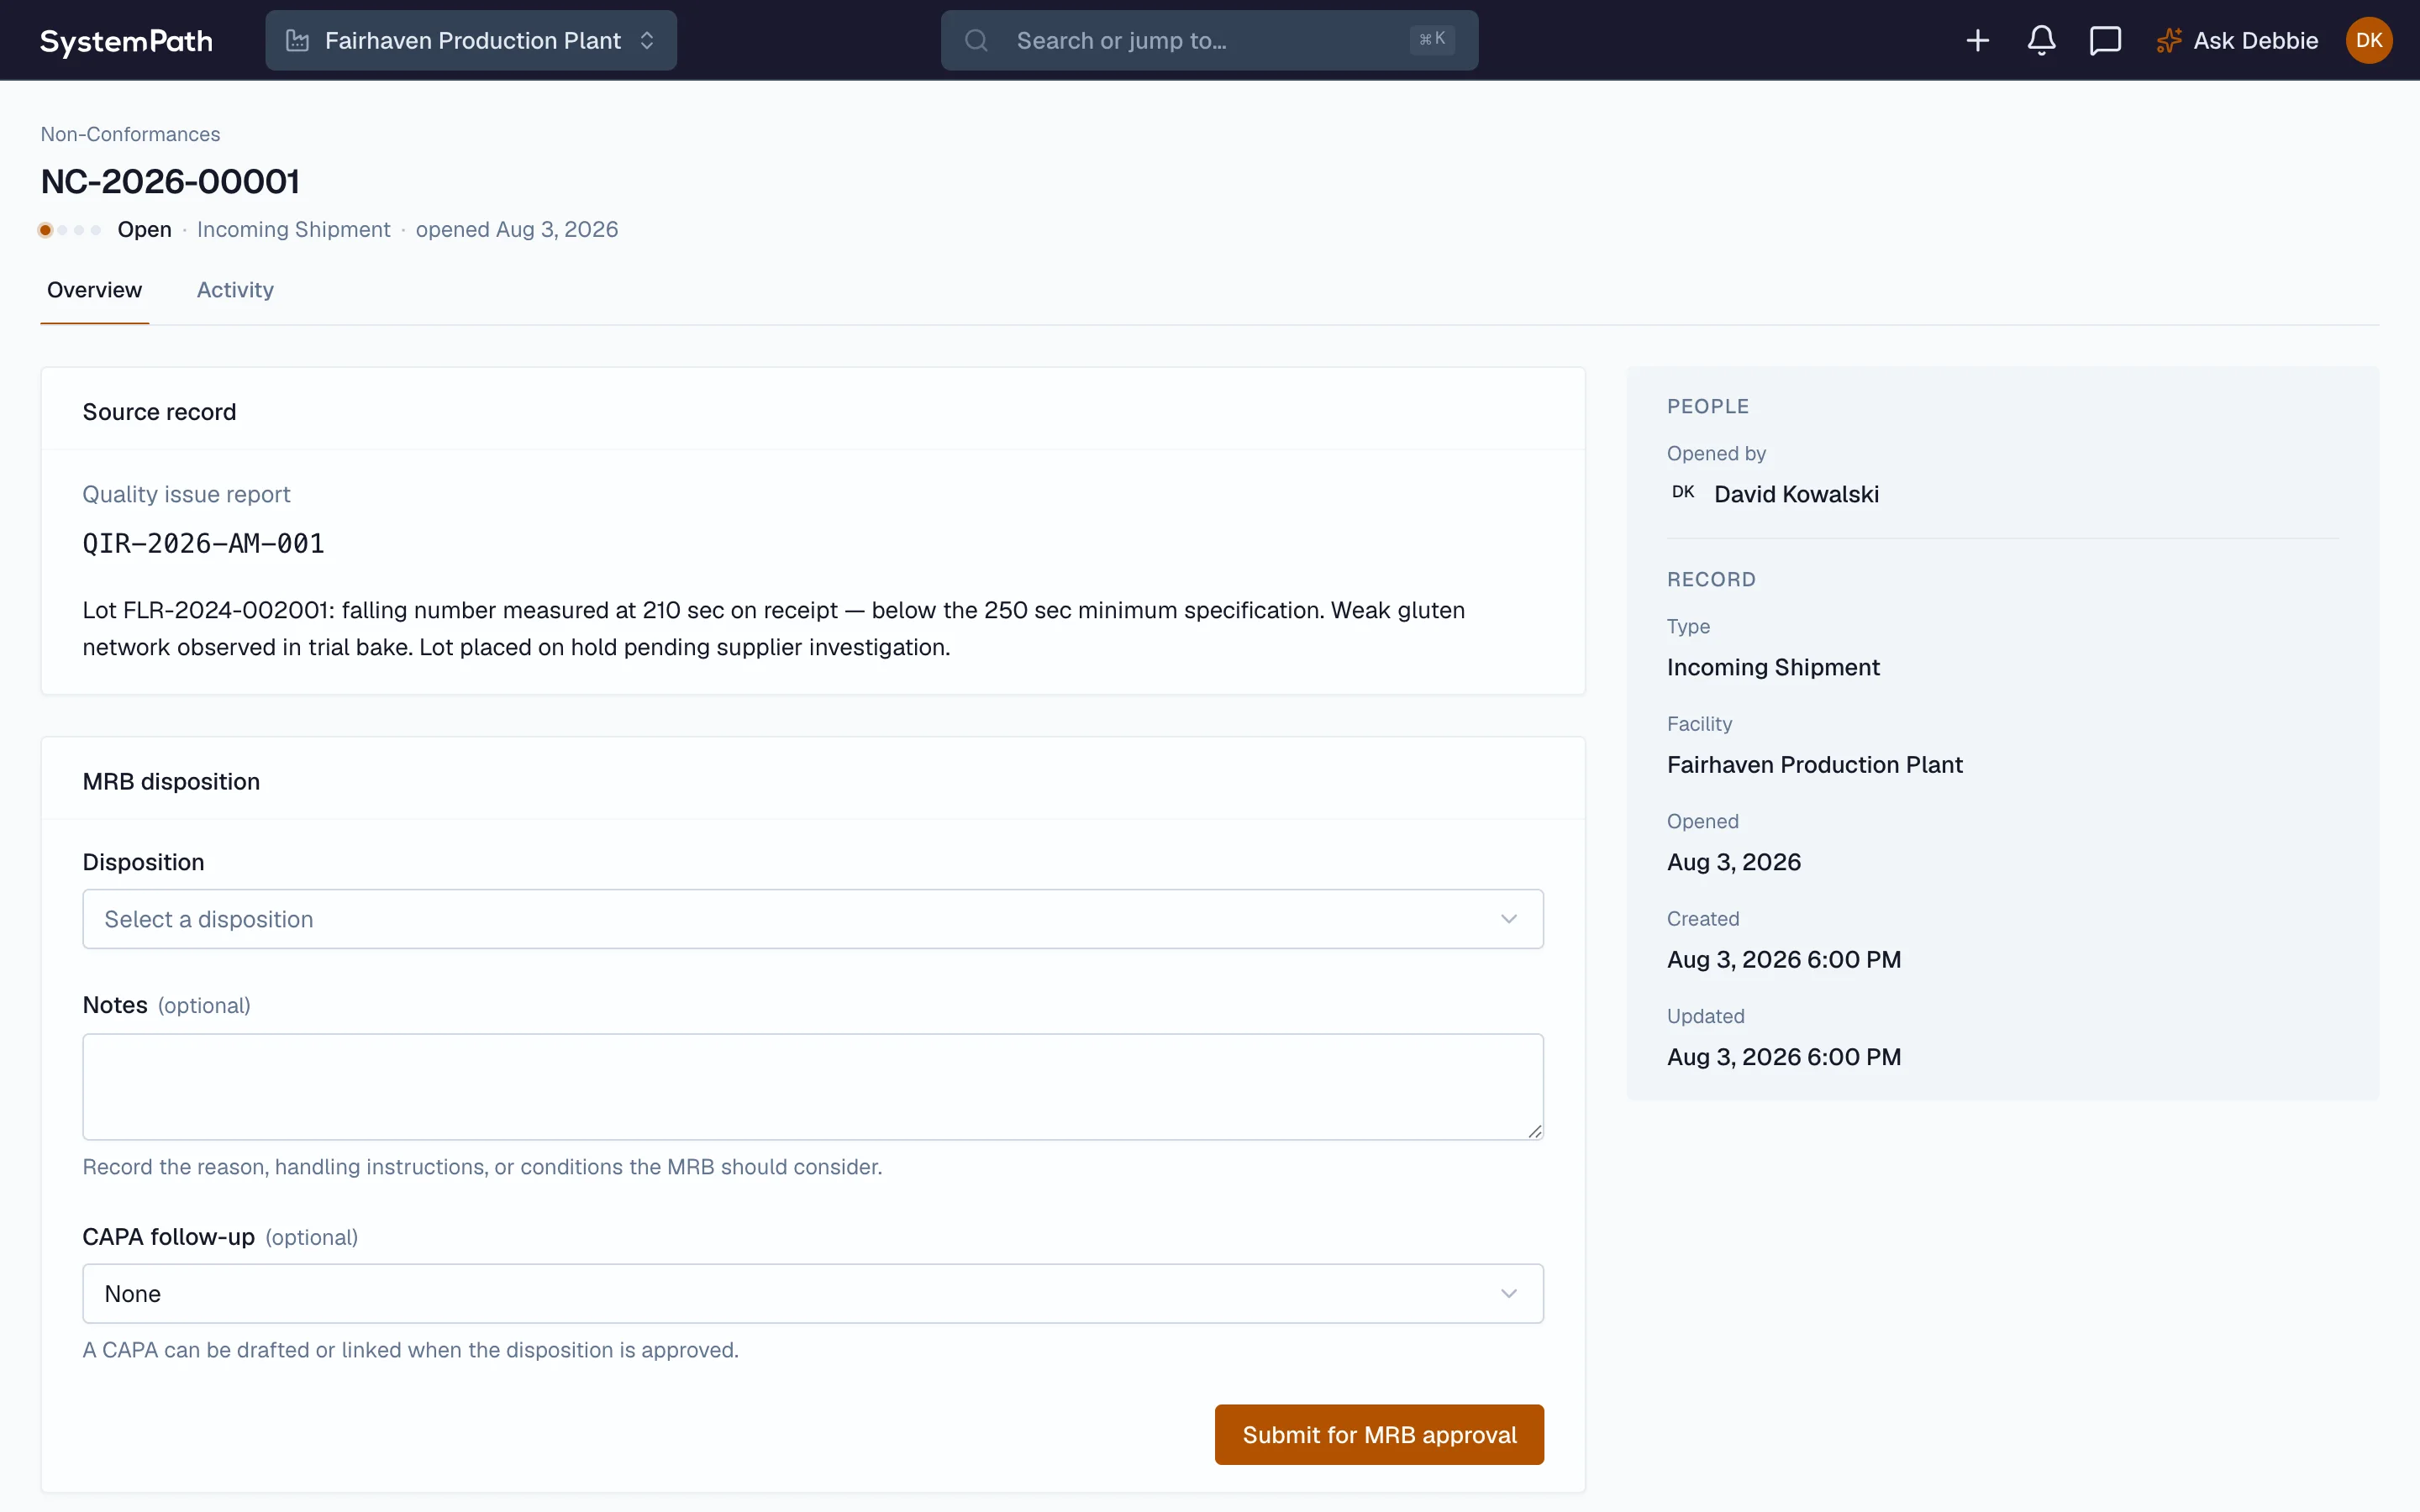
We write specifications that state the limit, the method, and what happens on failure. An out-of-spec result opens a non-conformance and holds the lot until a disposition is made, so the spec is a control, not a reference document.
Explore Specifications With Teeth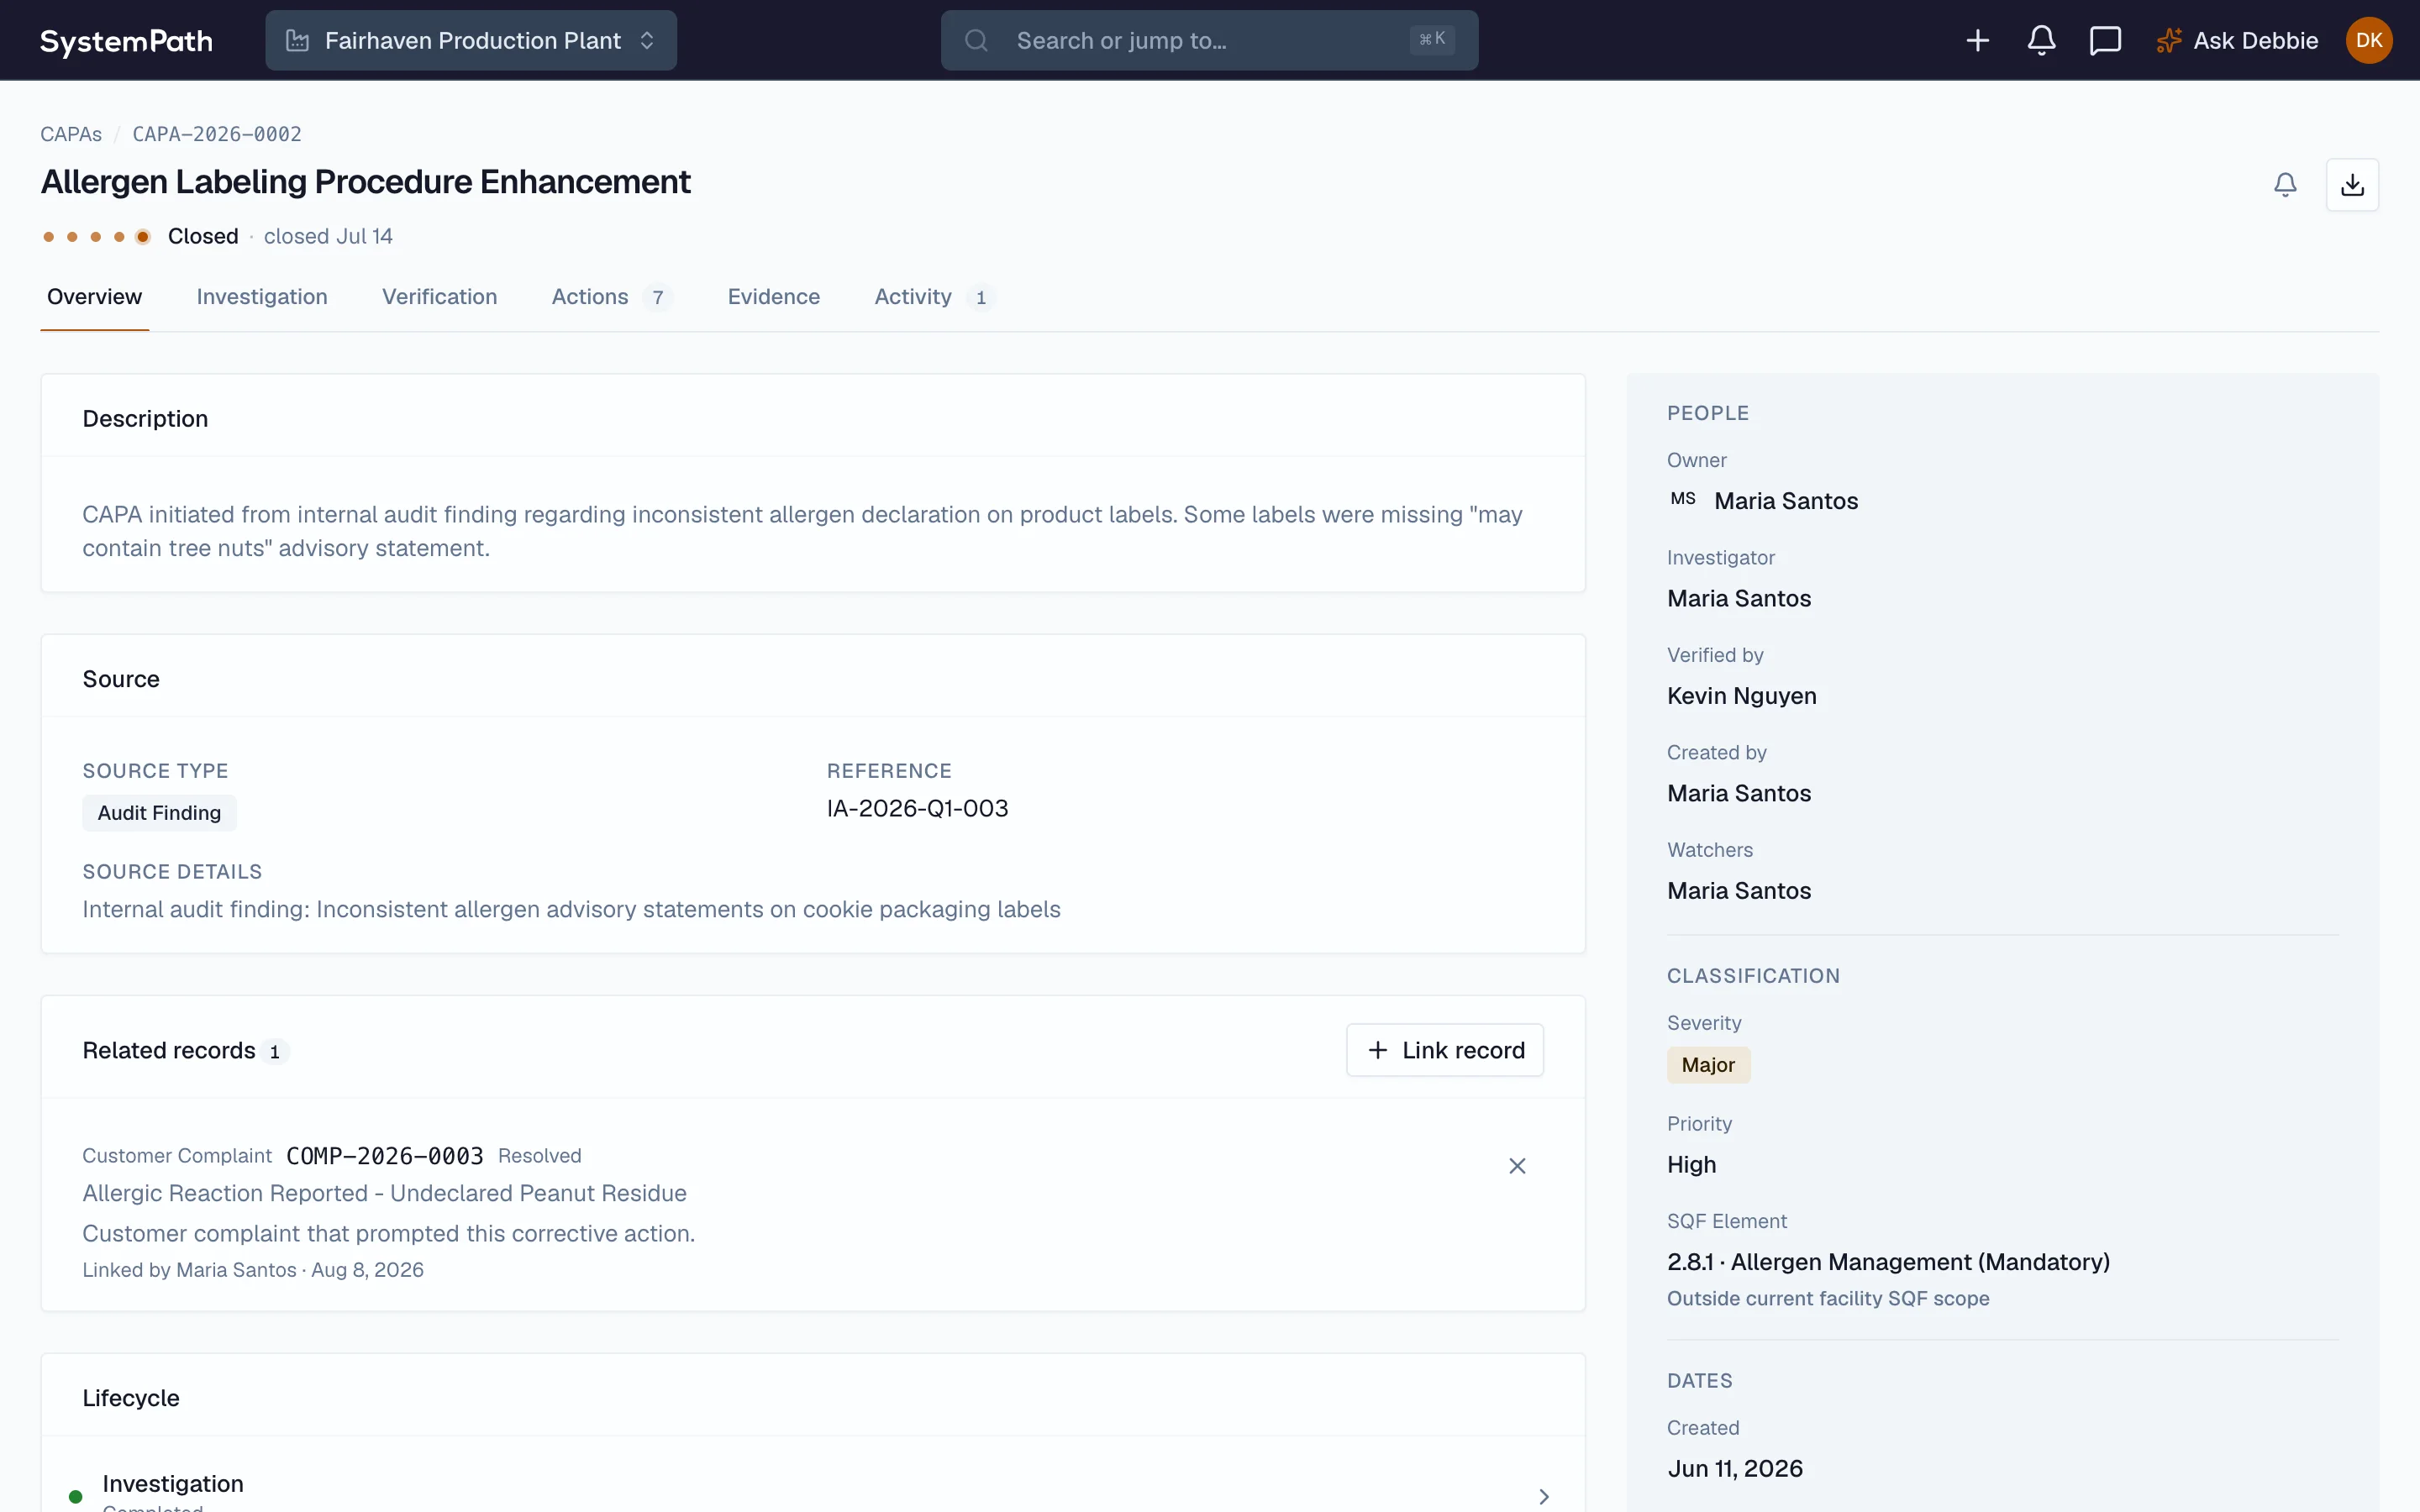
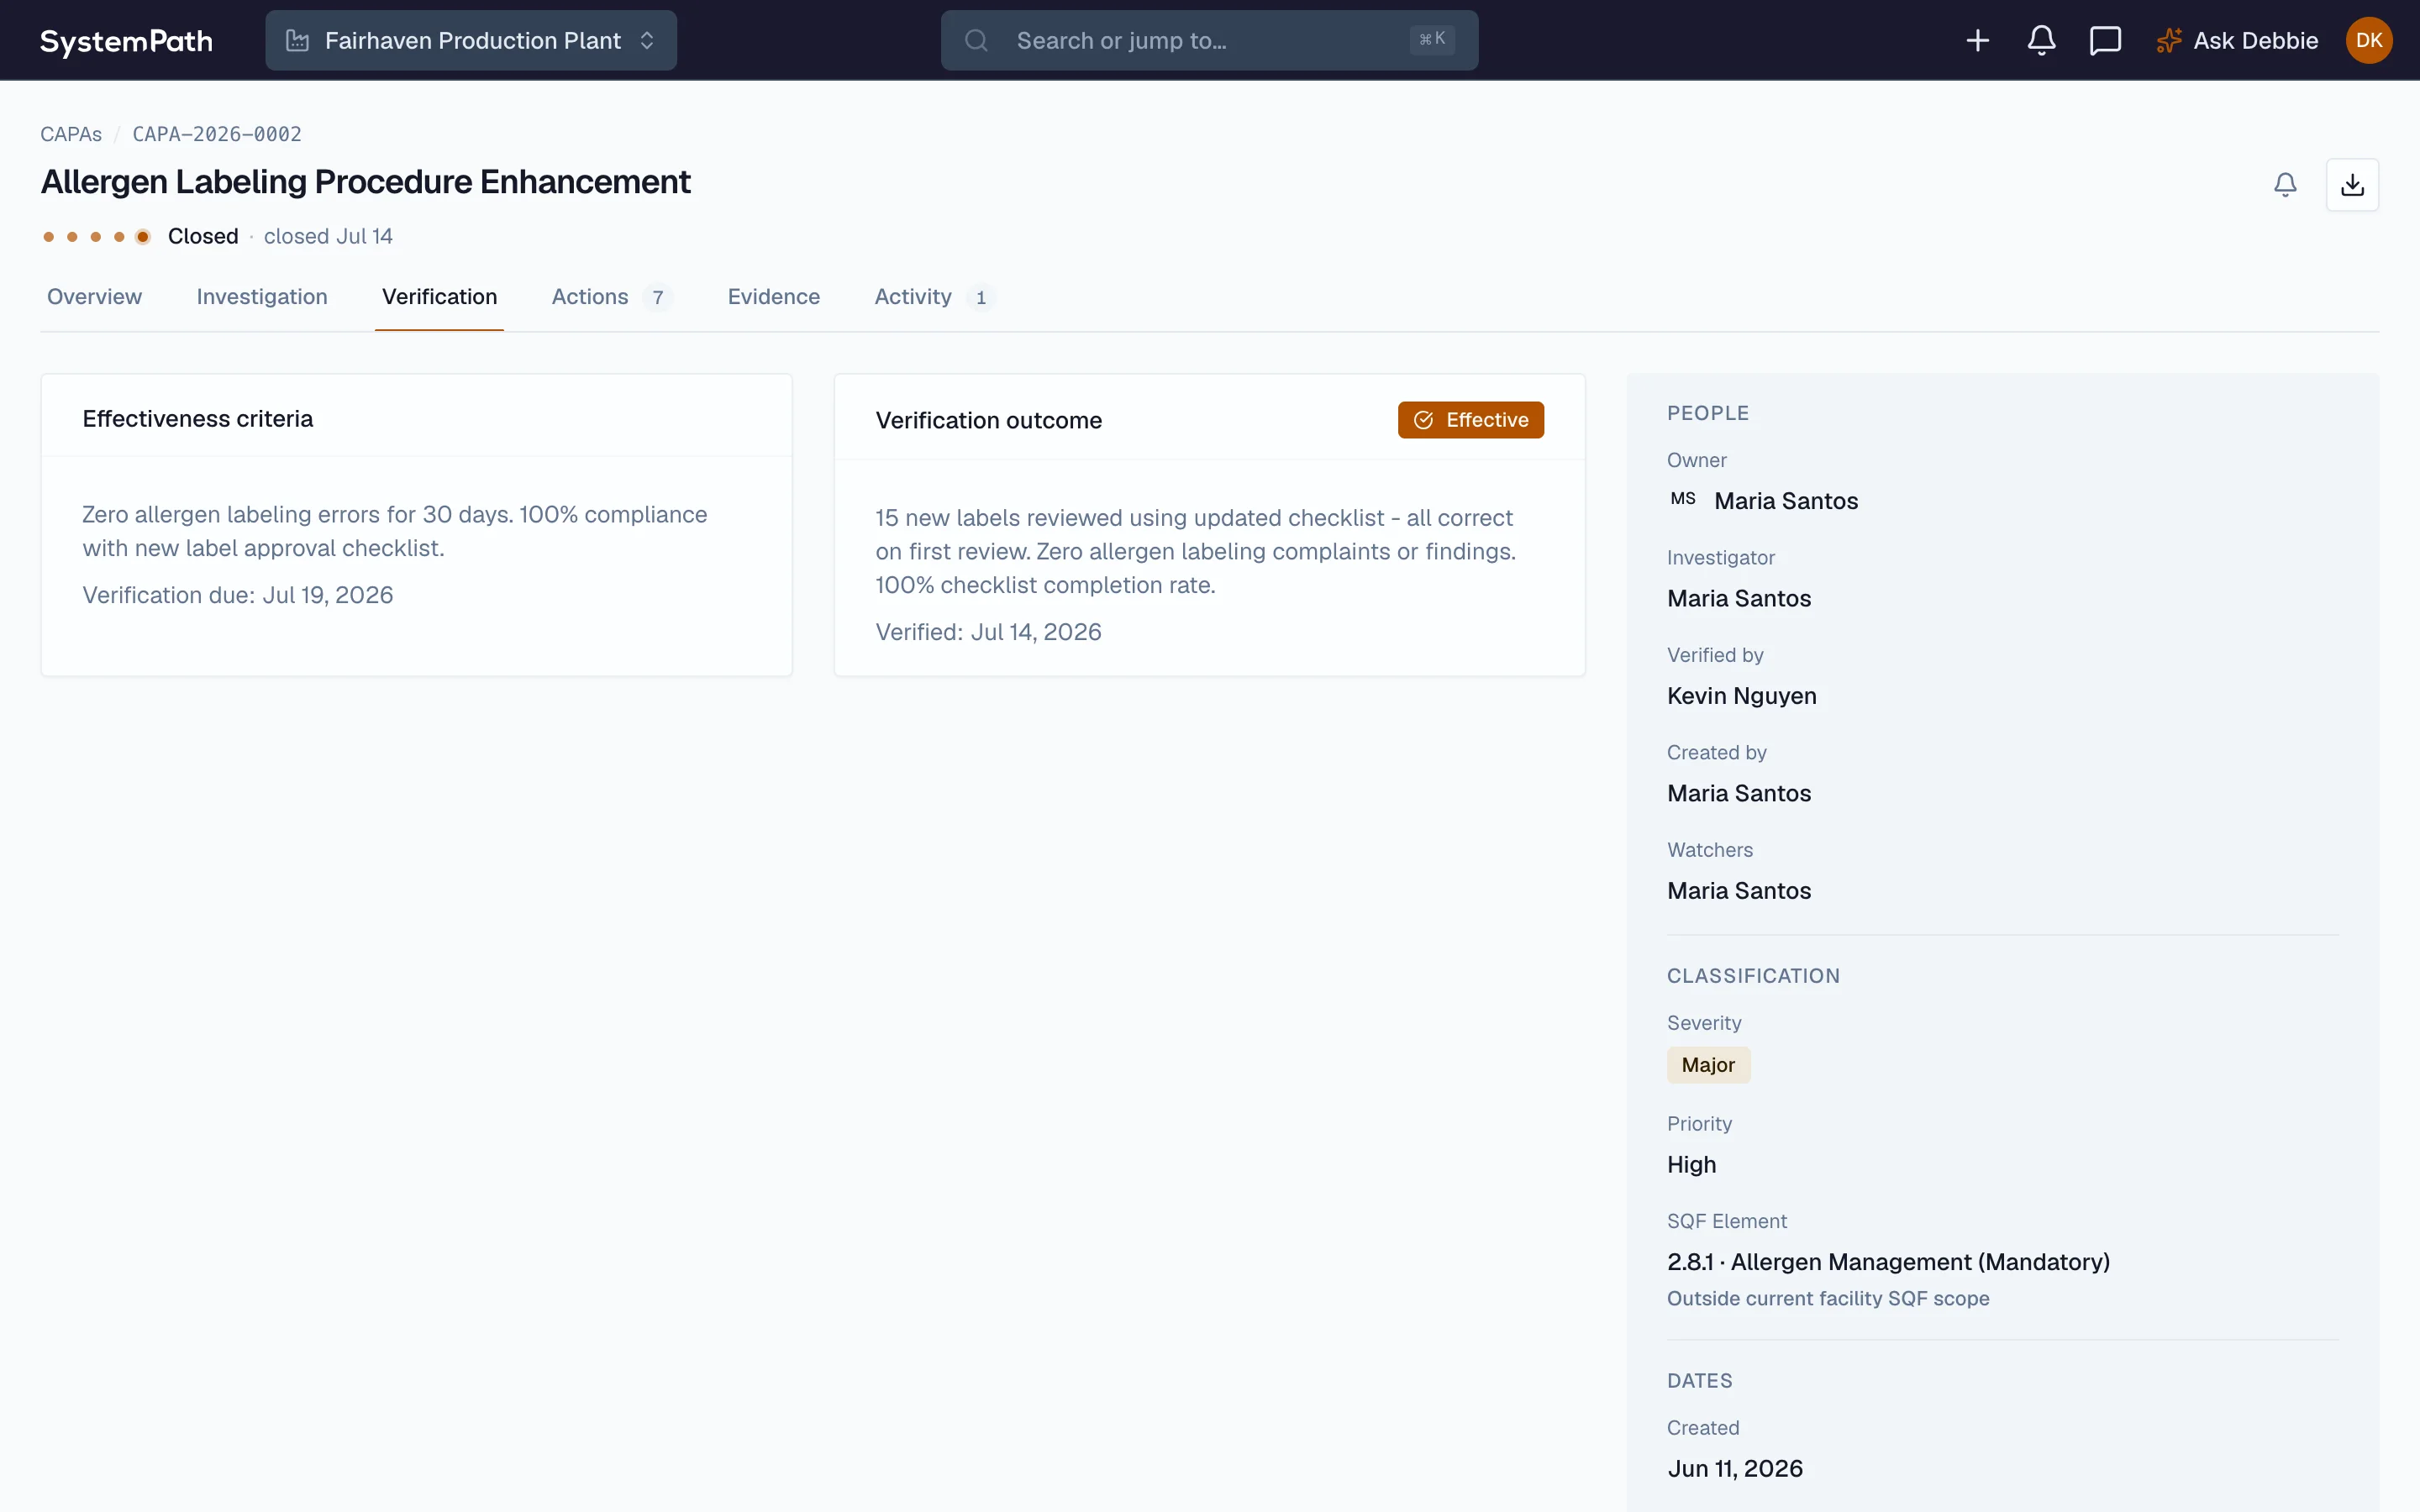
Held product gets dispositioned by the people with authority to decide, and a repeating failure escalates into a corrective action with root cause and an owner. One connected record from the failed check to the closed fix.
Explore Disposition and CAPA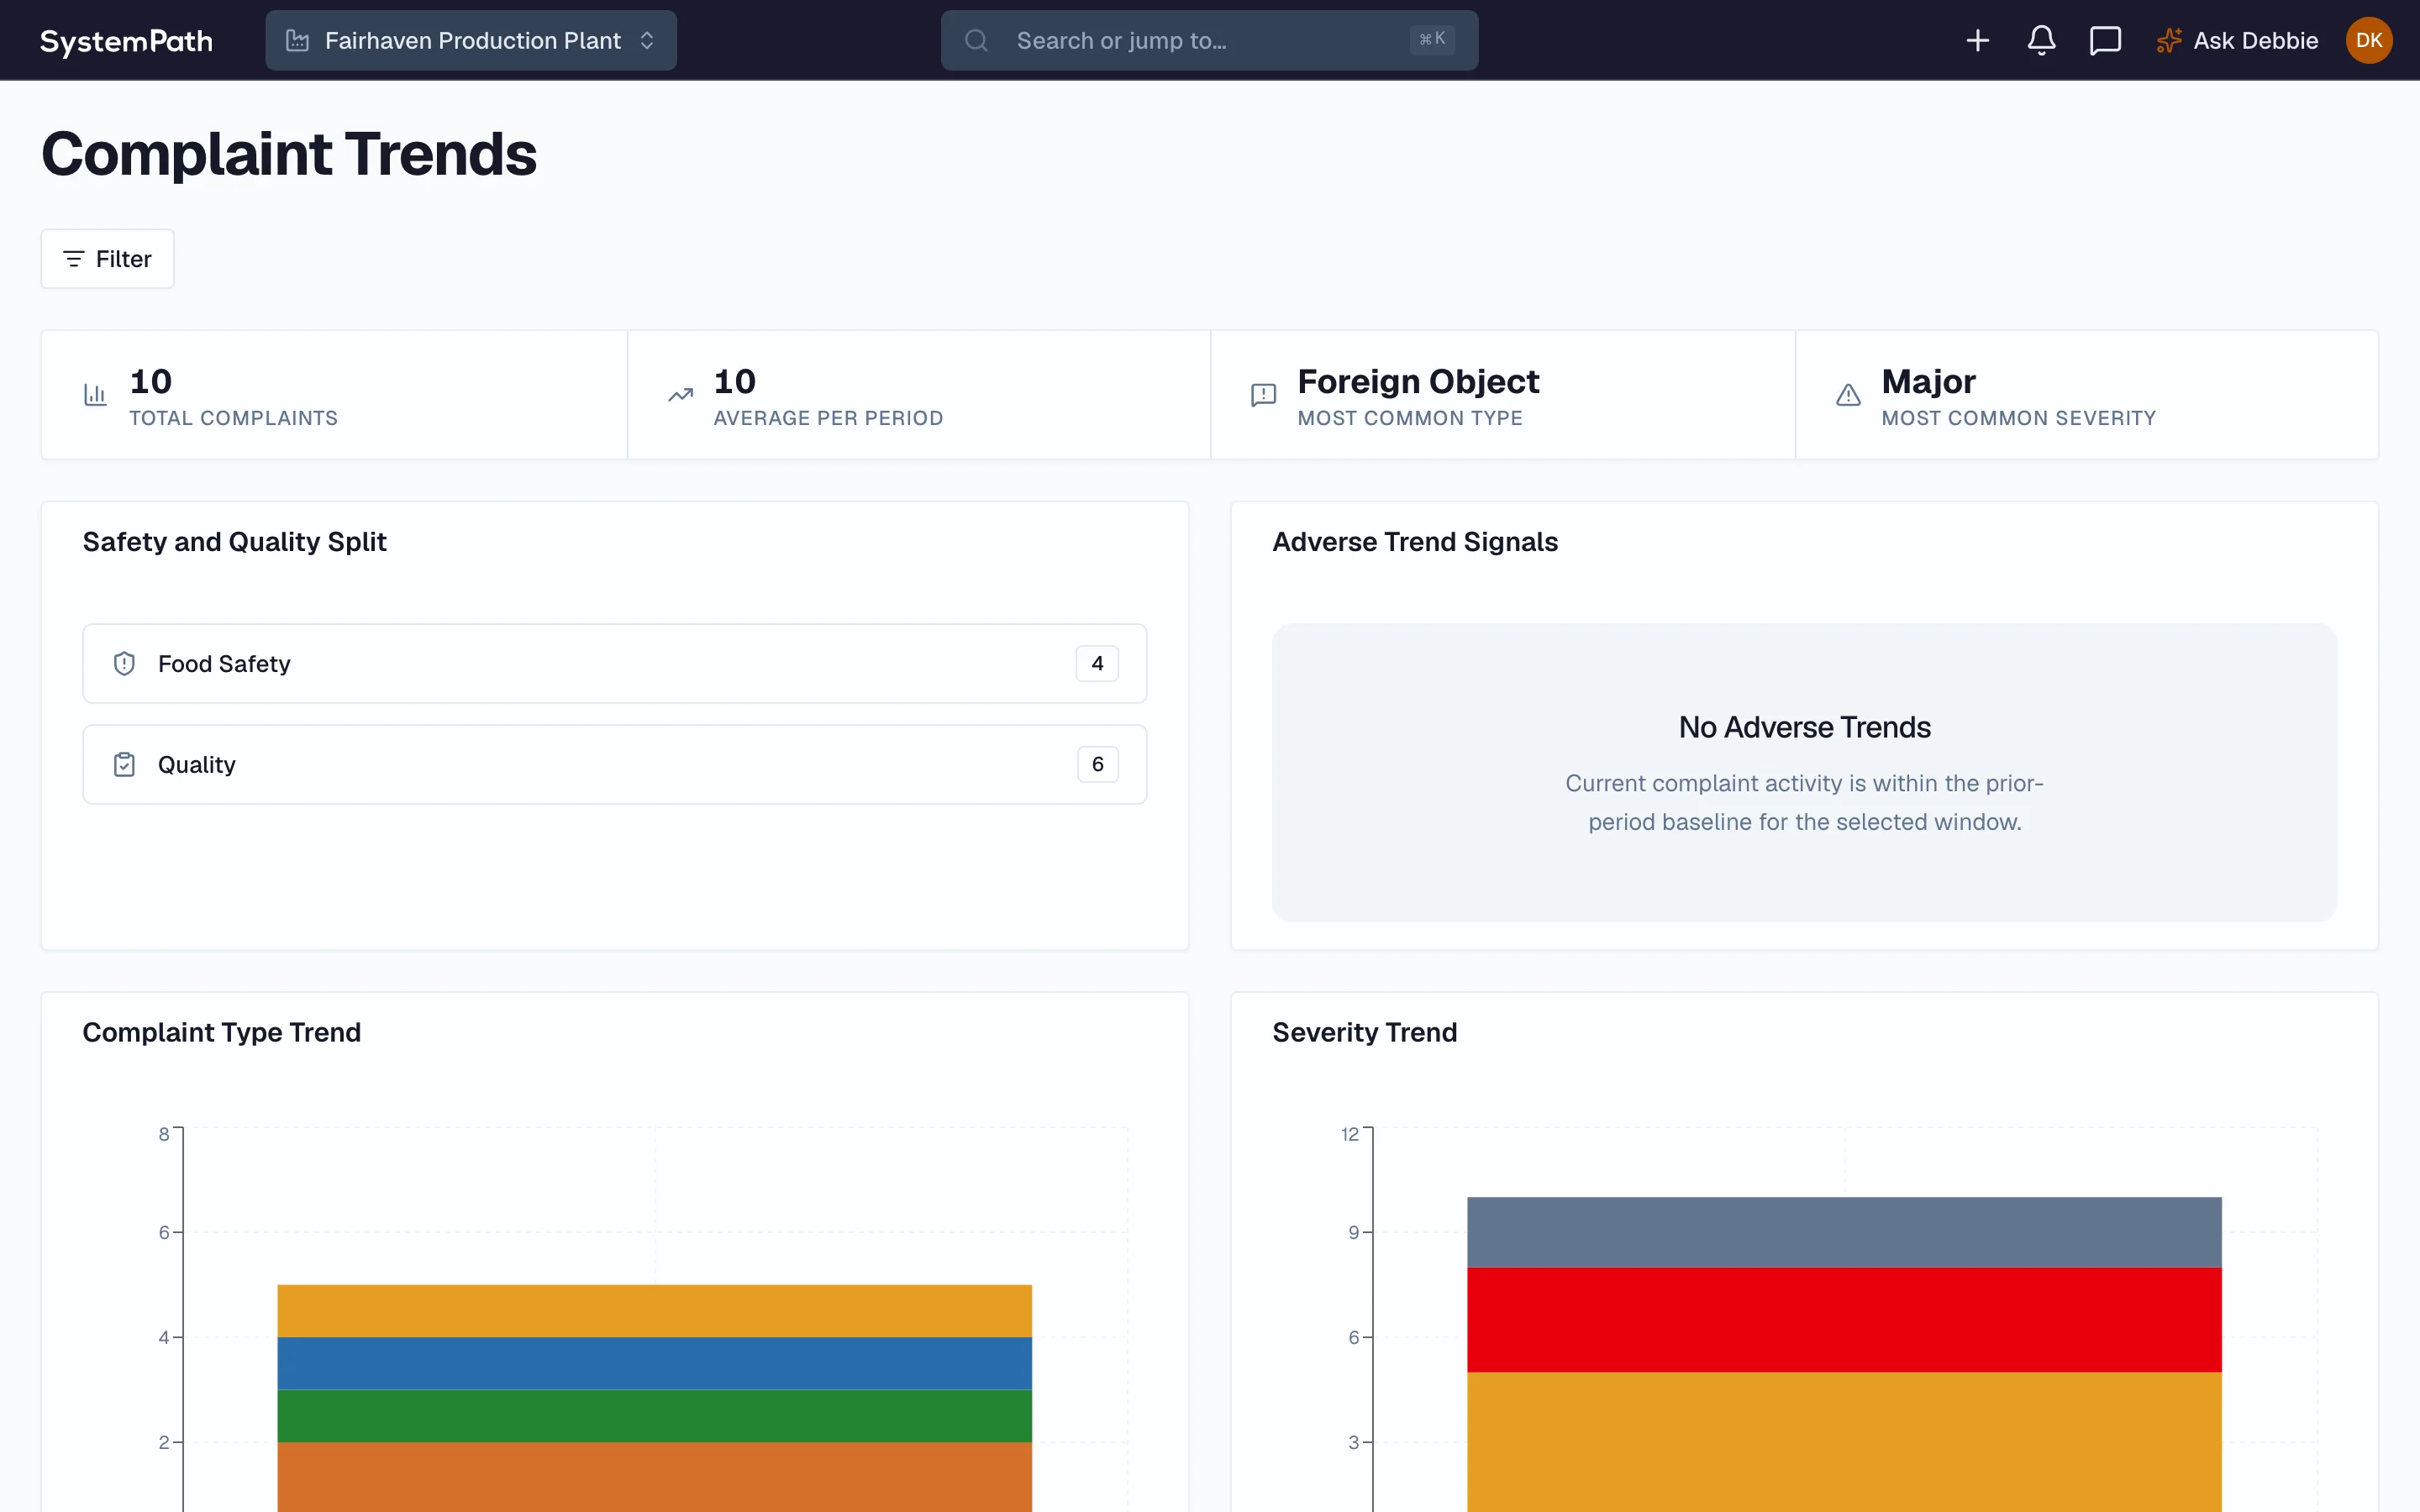
Quality data gets read against the prior period, so an adverse trend announces itself instead of hiding across a dozen closed records. The chart is only useful if someone is reading it, so the reading is built in.
Explore Trends Read Against BaselineFrom spec sheet to a process under control
The order matters. Specifications come first, because a chart without a disposition path just documents your failures more precisely. Then limits from your own data, charts where the operators are, and a response that runs without a meeting.
Start with a quality-plan reviewPick the measures that matter
1 weekTwo or three to start: the fill or weight target where drift costs money, and the quality attributes your customers actually reject on.
Write the specifications
1-2 weeksLimit, method, sampling, and the on-failure path: who holds, who decides, who signs. The spec becomes a control the moment it can stop product.
Baseline the process
2-4 weeksCollect enough data to know how the process behaves when nothing is wrong. Control limits calculated from this baseline, not copied from the spec.
Chart at the line
1 weekOperators record where they work and the chart updates as they do. A rule violation flags immediately, with the response procedure attached.
Define the response
1 weekFor each rule that can fire: what gets checked, what gets held, and when it escalates to a non-conformance. Decided in daylight, not mid-incident.
Read capability, then improve
quarterlyCapability against spec tells you whether the process has margin or is coasting on luck. That number decides where the next improvement effort goes.
What separates SPC from a chart on the wall.
Plenty of plants have charts. Far fewer have a process that answers to them.
Limits from data
Not from the spec sheet
Control limits copied from spec limits defeat the whole method. The process's own baseline sets the limits, or the chart is theater.
Charted at the line
Not month-end
A signal found in a month-end review is a post-mortem. The chart earns its keep in the half hour after the point lands on it.
A defined response
Decided before it fires
Every rule that can fire has a written answer: check what, hold what, escalate when. Otherwise the signal trains people to look away.
Capability, not hope
Margin you can prove
Capability against spec limits says whether the process has real margin. It is the difference between passing and knowing why you pass.
Not sure your charts would pass this list. Tell us which measure drifts the most and we'll tell you what we'd chart first.
Our quality-system work is led by a former SQF Lead Auditor who has seen every version of the chart on the wall and knows the difference between a quality plan that decides and one that files. Meet Jeff.
Your quality system runs in Beacon. Charts included.
Specifications, non-conformances, dispositions, and corrective actions live on one connected record, and the SPC module charts your measures with rule violations flagged as they happen. See how the quality module works.
Any consultant can write you a quality manual. The difference is whether the process is measurably under control a year later. See why teams build it with us.
Put control limits on the measures that cost you money
Bring your spec sheet and your most troublesome measure. In 20 minutes you'll know whether SPC would pay for itself on your line and where to start.
Prefer the phone? (313) 484-4887
What happens next
Discovery call
About your facility and goals. Not a sales pitch.
See it in action
A live walkthrough of Beacon scoped to your operation.
Custom proposal
Software, consulting, and training sized to your facility.
You'll talk with a food safety expert, not a sales rep.
20 minutes · No commitment · No pressure
Tell us which measure drifts the most
Net weight, fill, moisture, seal strength: name the one that keeps producing surprises. We come back with a read on whether it belongs on a chart, what the baseline would take, and what the first month would likely find.
Quality system and SPC questions, answered
Common questions from QA teams building a quality plan or bringing SPC to the line.